


How do yield curves occur?
Plotting the yields, or interest rates, of bonds with comparable credit ratings but different maturity dates is called a yield curve. Looking at the yield curve’s slope can help predict future economic activity and interest rate changes.
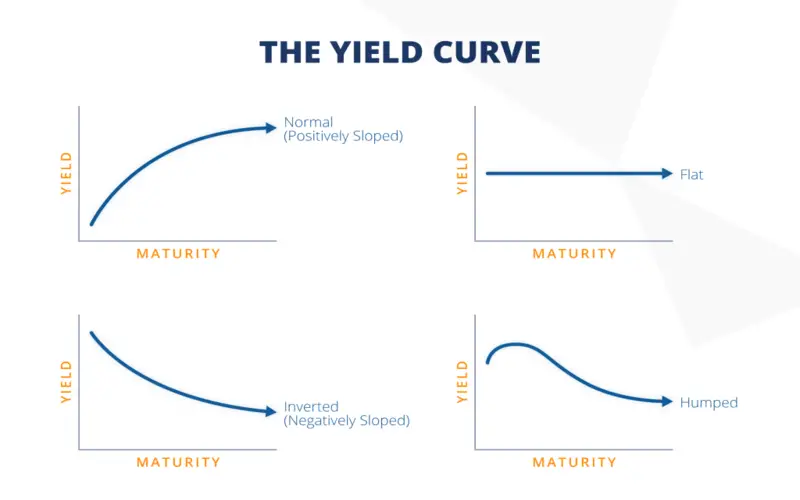
The three primary forms are the standard upward-sloping curve, the inverted downward-sloping curve, and the flat yield curve.
The Yield Curve Method
A yield curve may forecast changes in economic growth and production and is used as a benchmark for other debt in the market, such as mortgage or bank lending rates. Creating an Excel sheet that charts a yield curve and visually depicts the curve is a simple process.
The yield curve that is most often published contrasts U.S. Treasury debt maturities of three months, two years, five years, ten years, and thirty years. Every trading day by 6:00 p.m. E.T., yield curve rates are accessible on the Treasury’s interest rate webpages.
Investors may use the yield curve to forecast the state of the economy and guide their investment choices.
Various Yield Curve Types
The curve of Normal Yield
A typical yield curve slopes upward, with lower rates for bonds with shorter maturities and higher yields for those with longer maturities. According to this curve, longer-term bond rates are rising in response to economic boom times.
The points on the curve show the form of an upward-sloping angle as yields rise over time. A two-year bond with a gain of 1%, a five-year bond with a gain of 1.8%, a 10-year bond with a growth of 2.5%, a 15-year bond with an increase of 3.0%, and a 20-year bond with a 3.5% yield are a few examples of sample yields on the curve.
A standard yield curve indicates stable economic circumstances and a regular economic cycle. A steep yield curve, frequently associated with higher interest rates and inflation, indicates strong economic growth.
The yield curve is inverted.
The short-term interest rate is higher than the long-term rate on an inverted yield curve, which slopes downward. When there is an economic downturn, investors anticipate that longer-term bond rates will eventually decrease. This kind of yield curve is indicative of such times. Longer-dated bonds are more expensive and yield less than short-dated ones because investors looking for secure investments prefer to buy longer ones during economic downturns.
Although uncommon, an inverted yield curve portends a severe economic decline. An inverted yield curve has historically been seen as a recessionary signal.
Yield Curve Flat
A flat yield curve indicates an unclear state of the economy since it shows comparable rates for all maturities. The rates on a few intermediate maturities can be a little higher than average, creating a slight hump in the flat curve. These humps often occur in children between the ages of six months and two years.
The yield-to-maturity curves for bonds with shorter maturities and those with longer maturities are similar. A two-year bond, a five-year bond, a 10-year bond, and a 20-year bond might all offer a product of 6%, 6.1%, 6%, and 6.05%. Investors want comparable yields across all maturities during periods of heightened uncertainty.
A US Treasury Yield Curve: What Is It?
A line graph that compares the yields of short-term Treasury bills to long-term Treasury notes and bonds is known as the “U.S. Treasury yield curve.” The link between interest rates and the maturities of U.S. Treasury fixed-income instruments is shown in the chart. The term structure of interest rates is another name for the Treasury yield curve.
Yield Curve Risk: What Is It?
The risk investors in fixed-income securities, like bonds, bear when interest rates move negatively is called yield curve risk. The inverse link between bond prices and interest rates—bond prices go down as market interest rates rise and vice versa—is the root cause of yield curve risk.
How do investors use the yield curve?
Investors may use the yield curve to forecast the state of the economy and guide their investment choices. If the bond yield curve points to an economic downturn, investors may shift their funds into defensive assets, which typically perform well in recessions. Future inflation may be indicated if the yield curve steepens. Investors may steer clear of long-term bonds with a yield that will decrease in response to price increases in this situation.
The Final Word
The three primary forms are the standard upward-sloping curve, the inverted downward-sloping curve, and the flat yield curve. The yield curve’s slope predicts economic activity and fluctuations in interest rates. Investors may use the yield curve to forecast the state of the economy and guide their investment choices.
Conclusion
- The yield curves show bond interest rates with varying maturities and credit quality.
- There are three yield curves: flat, inverted, and routine.
- Standard curves indicate an expanding economy, whereas those that slope downward indicate a recessionary economy.
- Every trading day, yield curve rates are posted on the U.S. Department of Treasury website.
- The United States Treasury Department provides “Daily Treasury Par Yield Curve Rates.”


