A Linearly Weighted Moving Average: What Is It?
A moving average computation that gives more weight to recent price data is called a linearly weighted moving average (LWMA). Each previous price has gradually less weight than the current one, which has the maximum weight. The weights decrease linearly. Comparing LWMAs to exponential moving averages (EMA) and simple moving averages (SMA), LWMAs respond to price fluctuations more quickly.
How the Linearly Weighted Moving Average (LWMA) is Calculated
- Decide on a lookback date. This is the number of n values that the LWMA will compute.
- Determine the linear weights for every time interval. There are two ways to go about doing this. Assigning n as the first value’s weight is the simplest. For instance, when employing a lookback spanning 100 periods, the initial value is multiplied by 100, and the subsequent value is multiplied by 99. Selecting a different weight for the most recent value—say, 30—is a more involved method. Now, each number will need to decline by 30/100 such that when n-99 (the 100th period) is reached, the weight is one.
- To find the total, multiply the prices for each time by the corresponding weights.
- Divide the previous amount by the total of the weights.
We wish to find the linearly weighted average of a stock’s closing price over the previous five days.
Begin by multiplying today’s price by 5, yesterday’s by 4, and the price of the day before by 3. Up until the initial price in the data series, which is multiplied by 1, keep multiplying the price of each day by its position in the data series. The linearly weighted moving average for this period can be obtained by adding these values together and dividing the result by the total of the weights.
((P5*5)+(P4*4)+(P3*3)+(P2*2)+(P1*1)) / (5+4+3+2+1)
Assume that this stock’s price varies in the following ways:
- Day 5: $90.90
- Day 4: $90.36
- Day 3: $90.28
- Day 2: $90.83
- Day 1: $90.91
((90.90*5)+(90.36*4)+(90.28*3)+(90.83*2)+(90.91*1)) / (5+4+3+2+1) = 90.62
Over this timeframe, the LWMA for this stock is $90.62.
What information does the Linearly Weighted Moving Average (LWMA) provide?
The average price of an item over a specific period can be found using the linearly weighted moving average approach. This approach, used to examine market trends, gives more weight to new data than to older data.
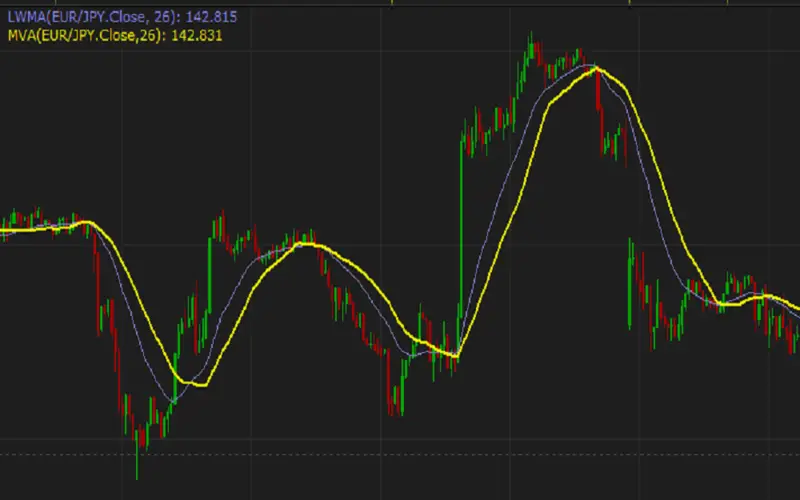
Generally speaking, an uptrend is confirmed when the price is above the weighted average (WMA) and the LWMA is rising. A downward trend in price is supported when the price is below the LWMA and the LWMA is pointing downward.
The price crossing the LWMA may indicate a shift in the trend. An indication of a change from an upward to a downward trend could be seen if the price is above the LWMA and falls below it.
The lookback time is something that traders need to consider when evaluating trends. The number of periods factored into the LWMA is the lookback period. Since even little price oscillations can quickly cross the line, a five-period LWMA is ideal for tracking modest trends and will track prices quite closely. There will frequently be wiggle room between the price and a 100-period LWMA because it will need to track the price more closely. This makes it possible to identify longer-term patterns and turning points.
Like other moving average types, the LWMA can occasionally show areas of support and resistance. For instance, in the past, the price often bounced off the LWMA before rising. This suggests that the line is assisting. The line might serve as assistance in the future. If you don’t, it can mean that the pricing trend has changed. It might be beginning a phase of more sideways movement or reversing to the downside.
What distinguishes a Double Exponential Moving Average (DEMA) from a Linearly Weighted Moving Average (LWMA)?
These two moving averages aim to lessen the SMA’s intrinsic lag. The LWMA does this by giving recent prices more weight. This is accomplished via the double exponential moving average (DEMA), which subtracts a smoothed EMA after multiplying the EMA over a given period by two. The MAs will produce various numbers on a price chart because of how they are calculated.
Using a Linearly Weighted Moving Average (LWMA) Has Its Limitations
All moving averages aid in their definition when trends are evident but offer little insight when market activity is erratic or mostly sideways. The price will fluctuate around the MA during these periods. The MA won’t deliver strong crossover or support/resistance indications in these situations.
An LWMA might not offer resistance or assistance. In particular, if it has yet to do so previously, this is likely.
Several misleading signals could appear before the emergence of a noteworthy trend. When the price crosses the LWMA but does not move in the anticipated direction, it is considered a false signal and can lead to bad trades.
Conclusion
- Use a linearly weighted moving average similar to an SMA or EMA.
- Use an LWMA to define price trends and reversals more clearly, generate trade signals based on crossovers, and identify probable locations of support or resistance.
- Traders who desire a moving average with less lag than an SMA can consider using an LWMA.