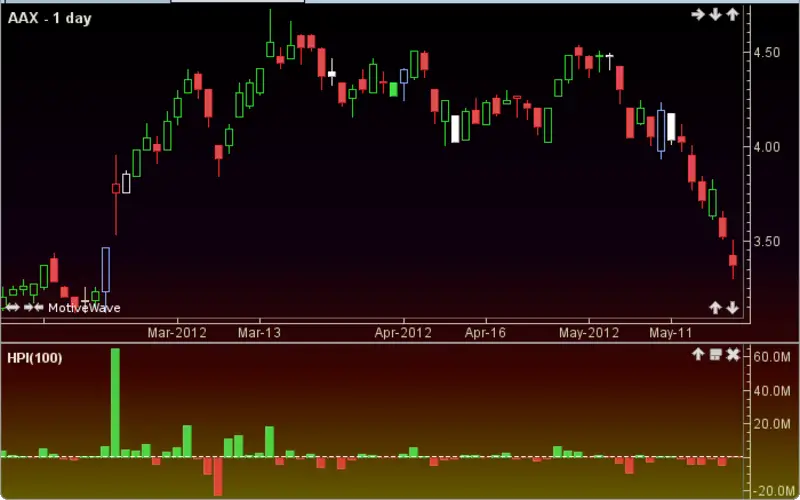
What’s the Herrick Payoff Index?
The Herrick Payoff Index is a technical analysis tool that measures price, volume, and open interest to identify future and option market trends and reversals. Market participants use the indicator to assess crowd behavior and track money movements to make predictions.
Understanding the Payoff Index
The Herrick Payoff Index considers derivative contract price, volume, and open interest to provide bullish and bearish indications. The technical indicator only works in options and futures markets since it calculates open interest. Most traders evaluate crowd psychology in futures and options markets with the Herrick Payoff Index. These markets have less liquidity and higher volatility than stock markets.
Bullish continuation signals occur when prices and open interest increase due to traders purchasing into the contract. A contract may have a bullish reversal when prices and open interest decline as selling pressure decreases and prices become more appealing.
Bearish continuation signals occur when prices fall, and open interest rises as traders place bearish wagers. A contract may reverse bearishly if prices increase and open interest declines, indicating bullish traders are losing momentum.
When the indicator is above the centerline, bullish traders are in charge; below, bearish traders are. However, traders should combine the signal with other technical indicators or chart patterns to increase their chances of profitable trades.
Adding technical indicators for confirmation helps minimize misleading Herrick Payoff Index alerts.
Benefits
The Herrick Payoff Index can suggest exits during trends. The Herrick Payoff Index suggests a price reversal when open interest diminishes. With this signal, traders may exit before the price drops. This is distinct from other technical indications that are trailing indicators. Moving average indicators, like the MACD, usually lag market price activity.
Because it operates in volatile futures and options markets, the Payoff Index gives more rewards for exiting trades before price drops. Given the massive leverage of these derivatives, even little drops in the underlying security price can result in significant losses. Even a 5% drop in stock price might result in a 25% loss for a call option.
Downsides
Due to its forward-looking reversal indications, the Herrick Payoff Index is less trustworthy for trading. Suppose prices decrease, and the Herrick Payoff Index shows diminishing open interest. Although negative pressure may be lessening, it does not signal a rebound is coming. The asset’s price might stabilize for an extended period. Famous trader Jesse Livermore referred to stocks as “listless drifters,” opposing them more than outright losses he would sell immediately. Average traders are more frightened of the losses possible with Herrick Payoff Index deals. Buying an asset during a price decline contradicts the belief that one should avoid chasing a falling dagger. Value investors typically aim to do so. Not many value investors employ technical indicators like the Herrick Payoff Index.
The Payoff Index increases the risk of hasty moves, even with exit indications. If trailing indicators give erroneous indications, followers might compensate by limiting losses. The Herrick Payoff Index gives exit alerts when prices rise, which may reignite interest and allow the security to rise unfettered. Letting go of a rising star may frustrate traders, especially those with less expertise.
Conclusion
- The payoff tracks money flows using price and volume data to corroborate derivatives market price trends or reversals.
- A trending market doesn’t stop the Herrick Payoff Index from sending signals.
- Use the index with other technical indicators since it might create false positives due to its forward-looking nature.