What is the hazard rate?
The hazard rate is the death rate for an object of a certain age (x). The hazard function, part of a larger equation, assesses the chance of an object surviving until a specific time, depending on its survival at an earlier time (t). This is the probability that if something survives one instant, it will survive the next.
Hazard rates refer to non-repairable products and are also known as failure rates. It is essential for designing safe systems in several areas, including commerce, engineering, finance, insurance, and regulation.
Understanding Hazard Rate
The hazard rate assesses an item’s age-related failure or death rate. Survival analysis is a field of statistics that applies methods to anticipate the time until an event, such as the death or failure of an engineering system or component.
Other research fields, such as reliability analysis (engineering), duration analysis (economics), and event history analysis (sociology), use the concept under other names.
Hazard Rate Calculation
The following equation calculates the hazard rate at any time:
h(t)=f(t)/R(t)
The probability density function (PDF) provides the likelihood of a failure or death occurring within a defined time, such as a year. However, R(t) reflects the survival function or likelihood that anything will live past t. Modeling the equation requires a “lifetime” and a non-negative hazard rate.
Example of Hazard Rate
Probability density estimates failure probability at all times. A human will die eventually. As you get older, your risk of dying at a certain age increases because the average failure rate is a ratio of the number of units in an interval to the total number of units at the beginning of the period.
To assess a person’s chances of dying at a specific age, divide one year by their maximum lifespan. This amount would increase annually.
People aged 60 have a more significant risk of dying at 65 than those aged 30, as the latter have more years to live and a lower probability of dying within a specific period.
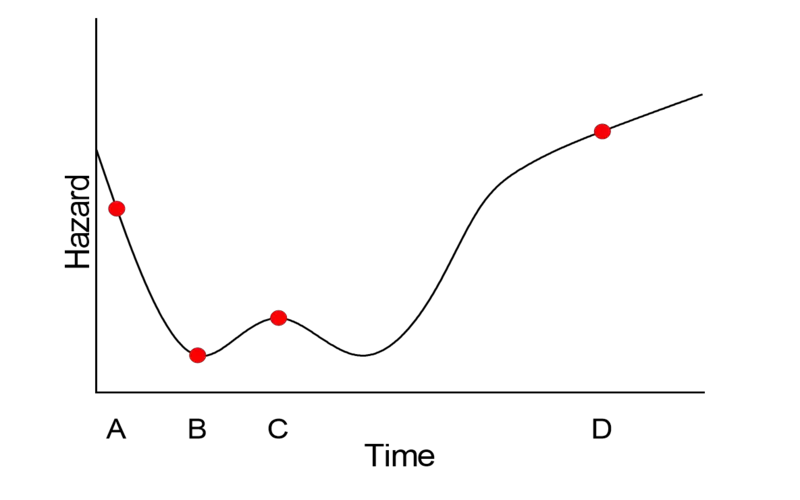
Curve Shape
Sometimes, the hazard rate resembles a bathtub. The curve dips downward, suggesting a decreased hazard rate, then levels off and rises as the object matures.
When an automaker builds a car, its parts shouldn’t break in its first few years. Older cars are more likely to break down. When the curve rises, the product’s useful life has ended, increasing the likelihood of non-random faults.
What is the difference between a failure rate and a hazard rate?
The failure rate is similar to the hazard rate. The failure rate is a hazard rate.
Why was this rate used?
The hazard rate estimates a subject’s survival odds at a given period. It works for any item with a set lifetime in engineering, health, and insurance.
The Bathtub Hazard Rate Curve
The bathtub curve shows the average failure rate of a product or group over time. The bathtub depicts three periods. The initial downward slope, or “infant mortality,” depicts the product’s first usage and goes from high to low failure. The line flattens over the useful life of assets with a generally constant failure risk. As the product wears out and degrades faster, the slope rises like a bathtub.
Bottom Line
The hazard rate is a straightforward method for estimating the chance of an object surviving a particular time point. That may not seem helpful or innovative. In several industries, this notion guides critical choices.
Conclusion
- The hazard rate is the death rate for an object of a certain age (x).
- The hazard function, part of a more significant equation, computes the probability of an item surviving to a specific time depending on its survival at an earlier time (t).
- Modeling the equation needs a “lifetime” and a non-negative hazard rate.