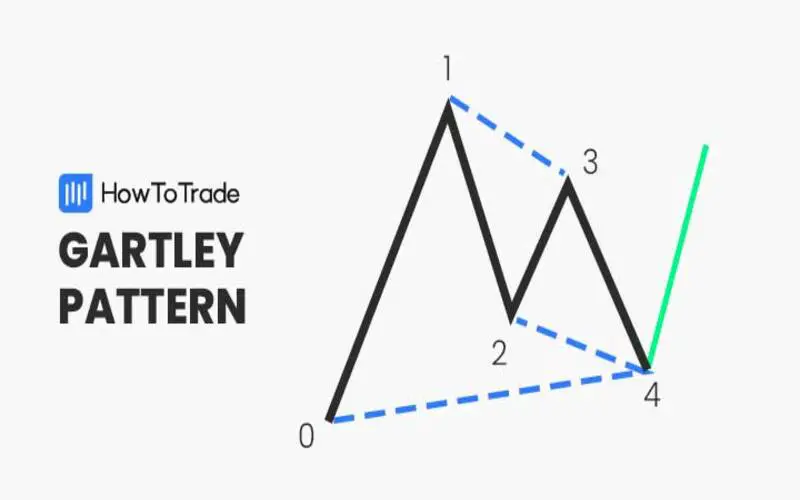
The Gartley Pattern?
The harmonic Gartley pattern, based on Fibonacci numbers and ratios, aids traders in identifying reaction highs and lows. In 1935, H.M. Gartley introduced harmonic chart patterns in his book Profits in the Stock Market. The most popular harmonic chart pattern is the Gartley pattern. Larry Pesavento introduced Fibonacci ratios to the pattern in his book, Fibonacci Ratios Using Pattern Recognition.
Explaining Gartley Patterns
The most popular harmonic chart pattern is the Gartley pattern. Harmonic patterns employ Fibonacci sequences to create shapes in prices, including breakouts and retracements. Technical analysts frequently employ techniques such as Fibonacci retracements, extensions, fans, clusters, and time zones to study the Fibonacci ratio, which is widespread.
Technical analysts sometimes combine the Gartley pattern with other chart patterns or indicators. The pattern may give a long-term outlook for the price, while traders focus on short-term transactions in the forecasted trend. Breakouts and breakdown price objectives can serve as support and resistance levels for traders.
These chart patterns offer valuable insights into price movement timing and amplitude rather than just one aspect.
Other famous geometric chart patterns for traders include Elliott Waves, which predict future trends based on price movements and their correlation.
Recognizing Gartley Patterns
Structure of the Gartley pattern:
The Gartley pattern depicts an uptrend from 0 to 1, with a price reversal at 1. According to Fibonacci ratios, the retracement between points 0 and 2 should be 61.8%. The price reverses again from point 2 toward point 3, a 38.2% retracement from point 1. The price reverses to 4 at point 3. The pattern completes at point 4, generating buy signals with an upward goal matching points 3 and 1 and a final price target of 161.8% from point 1. Point 0 sometimes serves as a stop-loss level for the transaction. Fibonacci levels need not be precise, although closer is better for pattern reliability.
The negative Gartley pattern, opposite the optimistic one, indicates a bearish decline with several price targets upon completion by the fourth point.
Conclusion
- Most harmonic charts use Gartley patterns.
- Point 0 or X is frequently the stop-loss, and point C is the take-profit.
- Use Gartley patterns with other technical analyses to confirm.


